Understanding Heatmap

Heatmap is a graphical way to display data where individual values are represented by colors. This method makes it easy to see complex data at a glance, highlighting areas of high or low activity without requiring numerical analysis. In digital contexts, heatmaps are often used to visualize user behavior on websites or applications, such as where users click, how far they scroll. Or where their mouse hovers.
The concept originated in the 19th century as a way to show weather patterns. But today, heatmaps are widely used in fields like marketing, user experience (UX) design. And search engine optimization (SEO). The color gradient typically ranges from cool colors like blue (low activity) to warm colors like red (high activity), allowing viewers to instantly recognize patterns or anomalies.
How Heatmap Works?
Heatmaps work by collecting and aggregating user interaction data, such as clicks, taps, scrolls. Or mouse movements. And then overlaying this data onto a visual representation of the webpage or screen. For example, a click heatmap shows where users click most frequently, with warmer colors indicating higher click density. Similarly, a scroll heatmap reveals how far down a page users typically scroll, using color gradients to show drop-off points.
To generate a heatmap, tools track user interactions using JavaScript or other tracking codes embedded in the webpage. The data is then processed and visualized, often in real-time or near real-time. Some heatmaps also include additional metrics, such as the average time spent on specific sections or the percentage of users who interact with certain elements.
- Click heatmaps: Show where users click on a page, helping identify popular or ignored elements.
- Scroll heatmaps: Indicate how far users scroll down a page, revealing content visibility.
- Move heatmaps: Track mouse movements to show where users hover or pause.
- Attention heatmaps: Combine multiple data points to estimate where users focus their attention.
Why Heatmap Matters?
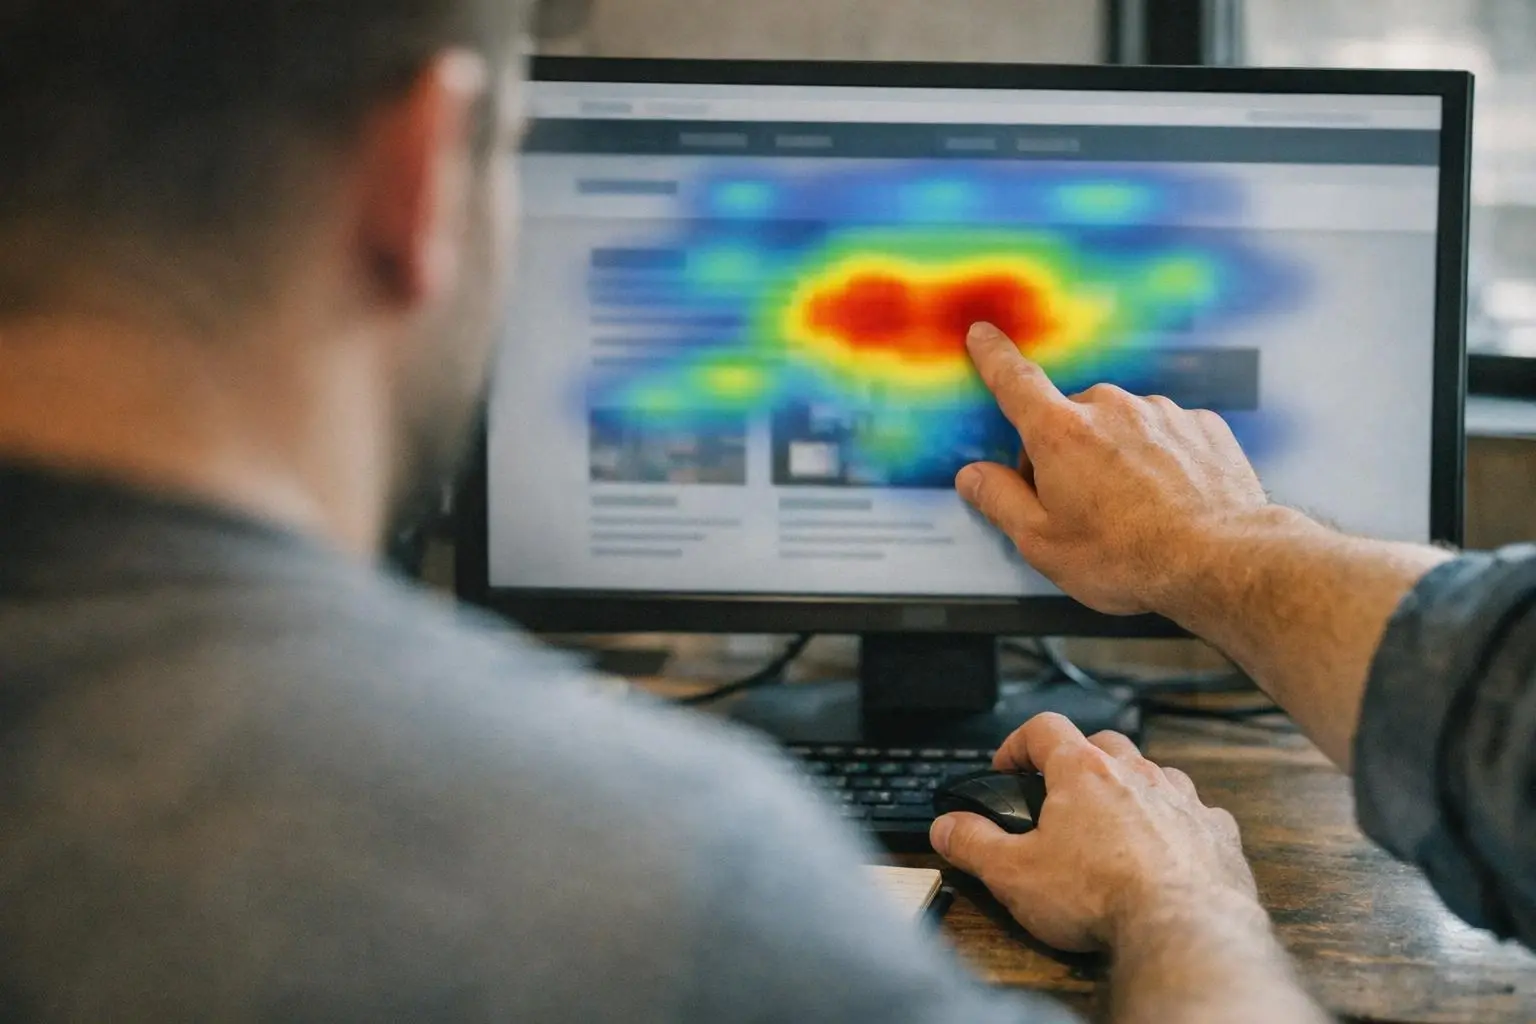
Heatmaps provide actionable insights that raw data or spreadsheets can't. By visualizing user behavior, businesses can identify usability issues, improve page layouts. And improve conversion rates. For example, if a click heatmap shows that users frequently click on a non-clickable element, designers can adjust the layout to make it interactive or remove distractions. Similarly, scroll heatmaps can reveal if important content is being overlooked because it appears below the fold.
In SEO and digital marketing, heatmaps help bridge the gap between quantitative metrics (like bounce rates or session duration) and qualitative insights (like user intent or frustration). This combination allows teams to make informed decisions about content placement, call-to-action (CTA) design. And overall user experience improvements.
When Heatmap Matters Most?
Heatmaps are particularly valuable in the following scenarios:
- Website redesigns: Before overhauling a site, heatmaps can identify what’s working and what’s not, reducing guesswork.
- A/B testing: Comparing heatmaps of different page versions helps determine which layout or content performs better.
- Conversion rate optimization (CRO): Heatmaps reveal friction points in forms, checkout processes, or landing pages.
- Content strategy: Scroll heatmaps show whether users engage with key content or abandon the page early.
- Mobile optimization: Heatmaps adapted for mobile devices highlight touch interactions and usability challenges unique to smaller screens.
For businesses in competitive markets like Austin, TX, where user experience can differentiate a brand, heatmaps provide a data-driven edge. They help ensure that websites and apps meet user expectations, leading to higher engagement, lower bounce rates. And improved conversions.